Waterways and Wetlands
There are over 8,400km of major rivers and creeks and more than 900 wetlands in the Port Phillip and Western Port region.
Climate change is expected to expose waterways and wetlands to:
- Increased long-term average temperatures.
- Increased hot-day temperatures.
- Lower and more erratic rainfall.
- Higher evaporation.
- Lower soil moisture.
- Increased fire-weather frequency and intensity.
- Declining and more erratic stream flows.
- Inundation of salt water from sea level rise.
Climate change effects on waterways and wetlands include:
- Stream flows could be reduced by between 3% and 11% by 2020 and up to 35% by 2050.
- While stream flows decline, water supply demand may grow. Larger parts of available stream flows could be diverted.
- More frequent bush fires will reduce water quality and catchment inflows.
- Increasing water temperatures and reduced flows will damage waterways and wetlands as natural environments.
- More intense rainfall and ‘flash’ floods will do economic, social and environmental damage to waterways.
Map: Waterways and wetlands sensitive to climate
Description:
The static map presented below depicts the sections of waterways and wetlands assigned a ‘very high’ or ‘catastrophic’ rating for their likely sensitivity to climate change (changes in annual rainfall and/or changes to maximum temperatures over the spring and summer period) under the Representative Concentration Pathway (RCP) 4.5 scenario. To view specific points of interest, please click on the map tab which displays an interactive map of waterways sensitive to climate change.
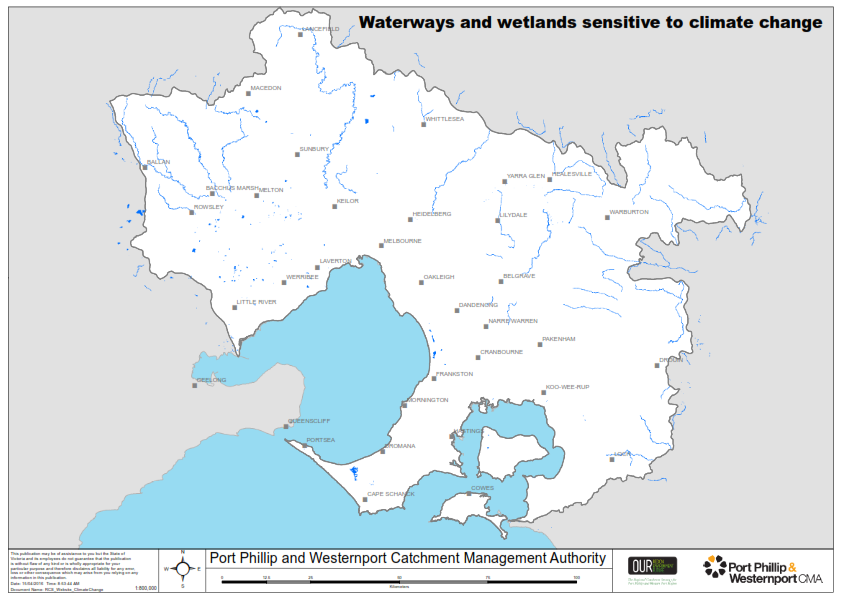
RCP 4.5 is considered to be a moderate scenario of future carbon emissions. Under the RCP 4.5 scenario, it is predicted that annual average rainfall could reduce by 16-34mm below the 1986-2005 average and maximum summer temperature could increase by 2-2.9 degrees above the 1986-2005 average. However, actual future changes could be smaller or larger depending on the actual effects of rising atmospheric carbon dioxide and the success of global carbon dioxide mitigation.
Sources:
Climate change pressures on waterways and wetlands information was derived from Dunlop, M, Parris, H, Ryan, P, Kroon, F, 2013, Climate-ready conservation objectives: a scoping study, National Climate Change Adaptation Facility, Gold Coast, Australia.
Please visit the Port Phillip & Westernport Regional Catchment Strategy for more information about waterways and wetlands in this region.